How the targets emerged
First 2°C, then 1.5°C
A 10°C difference is nothing unusual in a weather forecast. In climate policy, by contrast, half a degree has been debated for years. Why these particular figures?
The idea of a temperature limit did not suddenly emerge in 2015. Scientists had been studying how much warming the climate system could withstand for decades. In 1992, countries agreed in the UN Framework Convention on Climate Change on the fundamental aim of preventing dangerous human interference with the climate system. It did not yet specify a temperature threshold.
2010: 2°C and the question of going lower
At the 2010 climate conference in Cancún, countries agreed to keep the rise in global temperature below 2°C relative to pre-industrial levels. The same UN decision also called for a review of whether the target should be strengthened to 1.5°C.
Small island states were among the strongest advocates. For them, rising sea levels are not an abstract figure: on low-lying islands, even a few additional centimetres can affect how often flooding occurs and whether drinking water remains accessible.
2015: Paris sets both goals
The Paris Agreement was adopted on 12 December 2015.
It states:
Warming should be held well below 2°C, while efforts should be pursued to limit it to 1.5°C.
The 1.5°C target was not added later. Both targets have been part of the agreement since 2015. The IPCC Special Report of 2018 then examined the additional risks associated with warming of 2°C rather than 1.5°C.
What is being compared?
1.5°C - but where exactly?
The figure does not describe the temperature at a particular place or an exceptionally hot summer. It describes how much the long-term average temperature of the entire Earth's surface has changed relative to an earlier period.
This is easily misunderstood: global warming of 1.5°C does not mean that every place on Earth has warmed by exactly 1.5°C.
The oceans shape the average
Around 71 percent of the Earth is covered by water. On average, ocean surfaces warm more slowly than the air over land because water stores large amounts of heat and transports some of it into deeper layers. Temperature rises are therefore generally greater over the continents, especially in the Arctic.
The climate target does not apply only to the land on which we live. What matters is the combined change across land and ocean. That is what the global temperature records used in the Climate Chronicle show.
The starting point
Why 1850 to 1900?
Whenever the 1.5°C target is mentioned, it needs an important qualifier: relative to the pre-industrial period. But "pre-industrial" is not a date on the calendar.
Industrialisation began in some countries as early as the 18th century. Weather records exist from that time, but they are missing for large parts of the world. Only from the mid-19th century onward does the evidence become reasonably suitable for a global analysis.
The Intergovernmental Panel on Climate Change therefore uses the average from 1850 to 1900 as an approximation of the pre-industrial temperature. It does not represent a world entirely untouched by industrialisation, but it provides a scientifically useful reference period.
Why, then, is 1961 to 1990 so often mentioned?
Anyone reading about historical temperature data will often encounter the years 1961 to 1990. This is a climate normal period. The World Meteorological Organization (WMO) uses 30-year periods to smooth out short-term weather fluctuations and make temperatures comparable worldwide.
1961 to 1990 was the standard period for many years. HadCRUT5 still uses it as its baseline, partly because observations are particularly plentiful for this period.
Today, 1991 to 2020 is considered the current standard period, while 1961 to 1990 continues to be used for long-term climate comparisons.
Two things must be kept separate: the measured value and its baseline.
A simple example:
If the average is 10°C and a later measurement is 11°C, the difference is +1°C. Climate science calls this a temperature anomaly. It is not a faulty measurement, but simply the difference from a defined reference value.
However, 1961-1990 was already warmer than 1850-1900. Using the later period as the baseline therefore produces smaller anomaly values. The measurements are not wrong, but they cannot be compared directly with the Paris temperature target without conversion.
In the Climate Chronicle's global climate analysis, I therefore rebase the data to 1850-1900. The temperatures themselves do not change; only the position of the zero line does.
Good to know: The Paris Agreement does not specify particular years for "pre-industrial". The period 1850-1900 is the reference commonly used in climate research, based in part on the IPCC assessment.
Behind the numbers
How has the temperature of the entire Earth been measured since 1850?
There is, of course, no single global thermometer. Today, countless weather stations, ships and buoys collect observations. But in 1850 there were no satellites, no automated data collection and large blank areas on the weather map.
For the global analysis, I use HadCRUT5. The dataset is produced by the UK Met Office Hadley Centre and the Climatic Research Unit at the University of East Anglia. It combines two different types of temperature observation.
Over land: weather stations and old records
Land temperatures come from the CRUTEM5 dataset. More than 10,000 weather-station series were assessed for the current version, and nearly 8,000 were included in the global grid. More than 2,000 stations were available by 1900, but there were still very few in the 1850s.
A look at the University of Graz climate data archive shows what such early records looked like. Temperatures were entered into tables by hand - pieces of paper that have become valuable to climate research today.

The measurements cannot simply be placed side by side without careful checks. Stations have moved, instruments have been replaced and towns have grown. Such changes can affect a measurement series.
The data are therefore checked continuously and, where necessary, adjusted using scientifically justified methods. After all, they provide an important basis for far-reaching decisions. NASA, NOAA and Berkeley Earth publish temperature series of their own alongside HadCRUT5. Despite their different methods, all show a clear warming trend with comparatively small differences between them. The data and methods are largely public and can be independently verified.
At sea: buckets in the past, buoys today
Sea-surface temperatures have their own dataset: HadSST4. The early measurements are particularly interesting. Sailors hauled seawater aboard in buckets and measured its temperature. Later, readings from ships' engine-cooling water became more common. Today, observations come mainly from ships and from moored or drifting buoys.
That sounds like quite a mixture - and it is. Water in a bucket can cool down, engines can affect readings, and historical shipping routes did not cover the oceans evenly. All these differences must be accounted for in the analysis. One important historical source is ICOADS, an international collection of marine observations.
And how does this become a global average?
Simply adding up every station value would not work. Europe has far more weather stations than some parts of Africa, so the number of thermometers would distort the average.
Instead, scientists divide the Earth into a regular grid. HadCRUT5 uses cells measuring 5 x 5 degrees.
For comparison:
In Austria, a 5? x 5? cell is roughly 550 x 400 km. Its actual size depends on its geographic location.
The available temperature anomalies are combined for each grid cell. These are then used to calculate a global average that accounts for the actual area of each cell.
One problem remains:
Where nobody took measurements in the past, data are missing. HadCRUT5 therefore provides a version that fills these gaps using statistical estimates. To represent the uncertainty, 200 slightly different but plausible calculations are made. This is called an ensemble. The Climate Chronicle uses the ensemble mean, the average of all 200 calculations. This concerns the accuracy of historical temperature estimates, not forecasts of the future.
Who updates these numbers?
New months are added regularly. Older values are also improved when, for example, additional archive data become available or measurement methods can be accounted for more accurately. HadCRUT5.2.0.0 was released in September 2026, so historical values may differ slightly between dataset versions.
HadCRUT5 is not the only global analysis. NASA GISTEMP, NOAA GlobalTemp and Berkeley Earth also calculate global temperature series. Europe's Copernicus service uses the ERA5 reanalysis, which combines observations with weather models. The methods differ, but the long-term warming trend is clear in all of them.
How the data are prepared
Global temperature in the Climate Chronicle
The Climate Chronicle's standard temperature views show my processing of official station data from the countries included in the project. Those records are not sufficient for the entire Earth, especially not for the oceans.
The global view therefore uses the published HadCRUT5 data directly. I do not combine thousands of historical weather stations into a new global curve myself; I prepare the scientific series for display. The baseline is converted to 1850-1900 separately for each calendar month.
A curve from 1850 to today
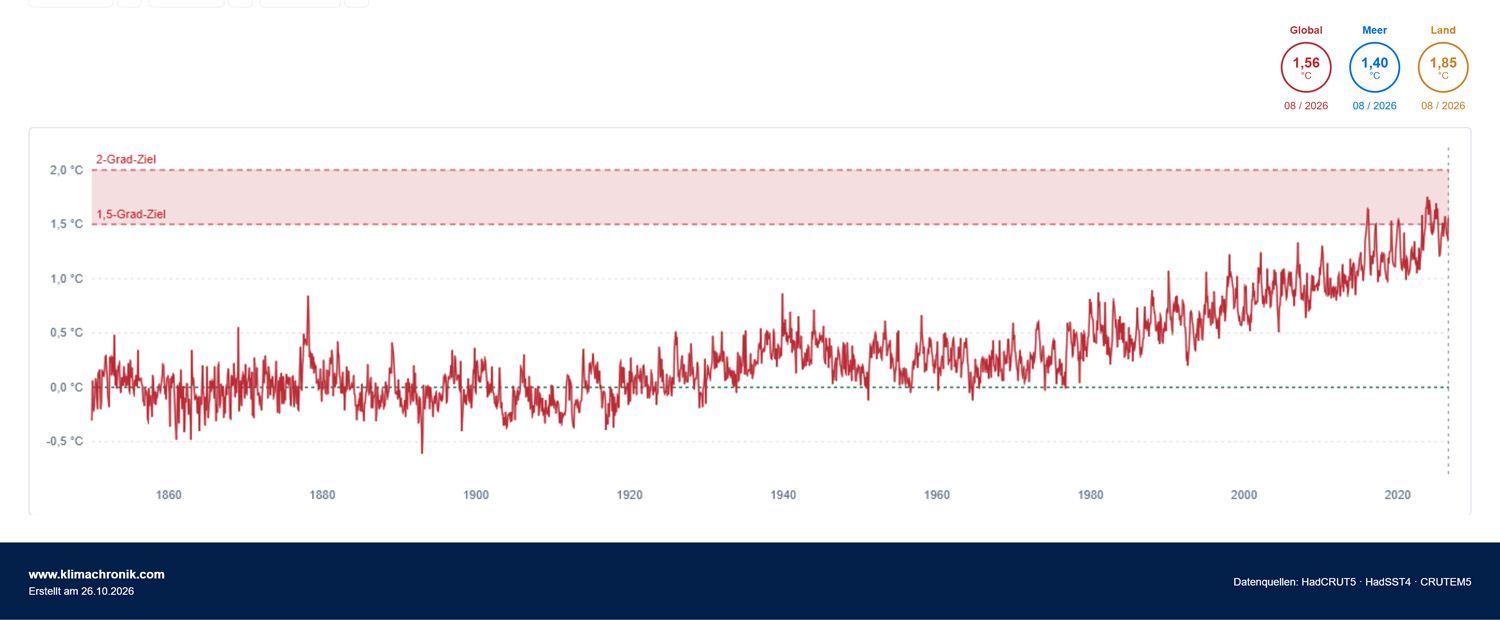
The curve does not rise in a straight line. It includes warm and cool swings, unusual individual years and longer phases. The upward trend becomes especially clear from the 1970s onward. Short-term fluctuations caused by factors such as El Niño or volcanic eruptions do not alter the long-term trend.
Land and sea viewed separately
The contrast between land and ocean temperatures is striking: on average, the continents have warmed much more than the sea surface. The two curves show why a global figure cannot simply be applied to Austria or any other country.
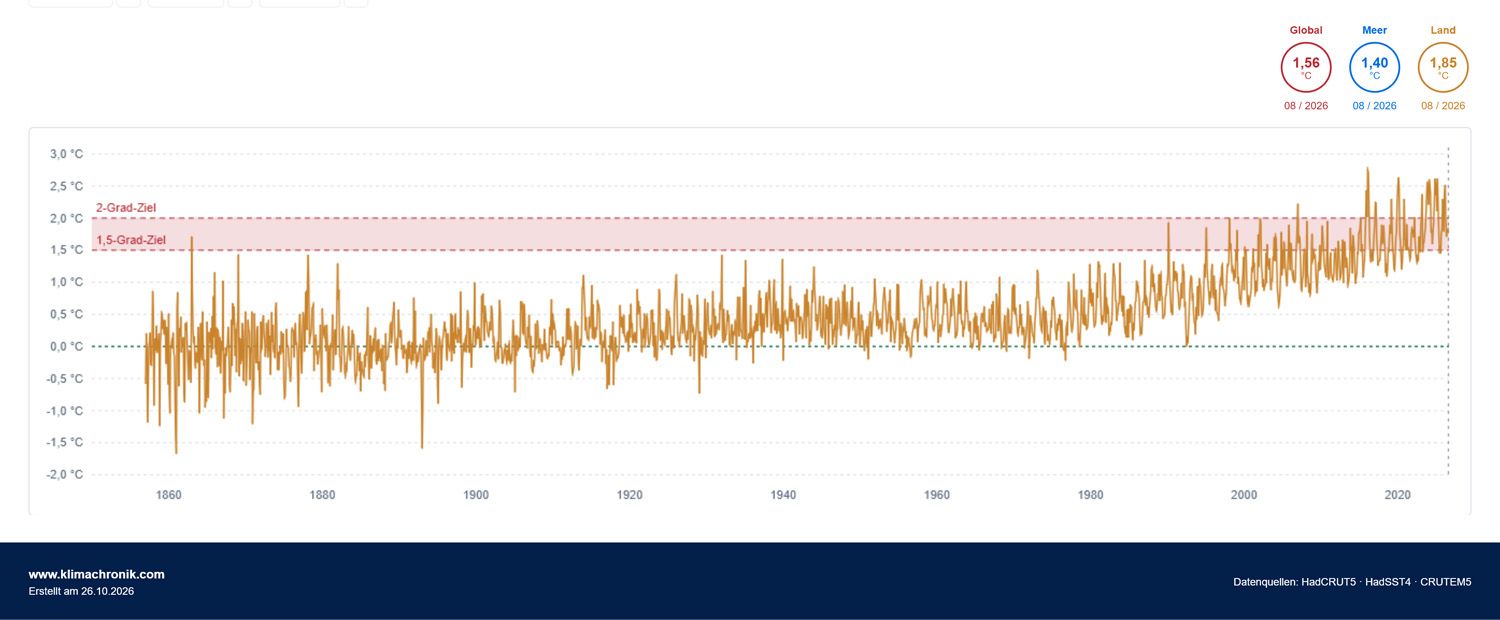
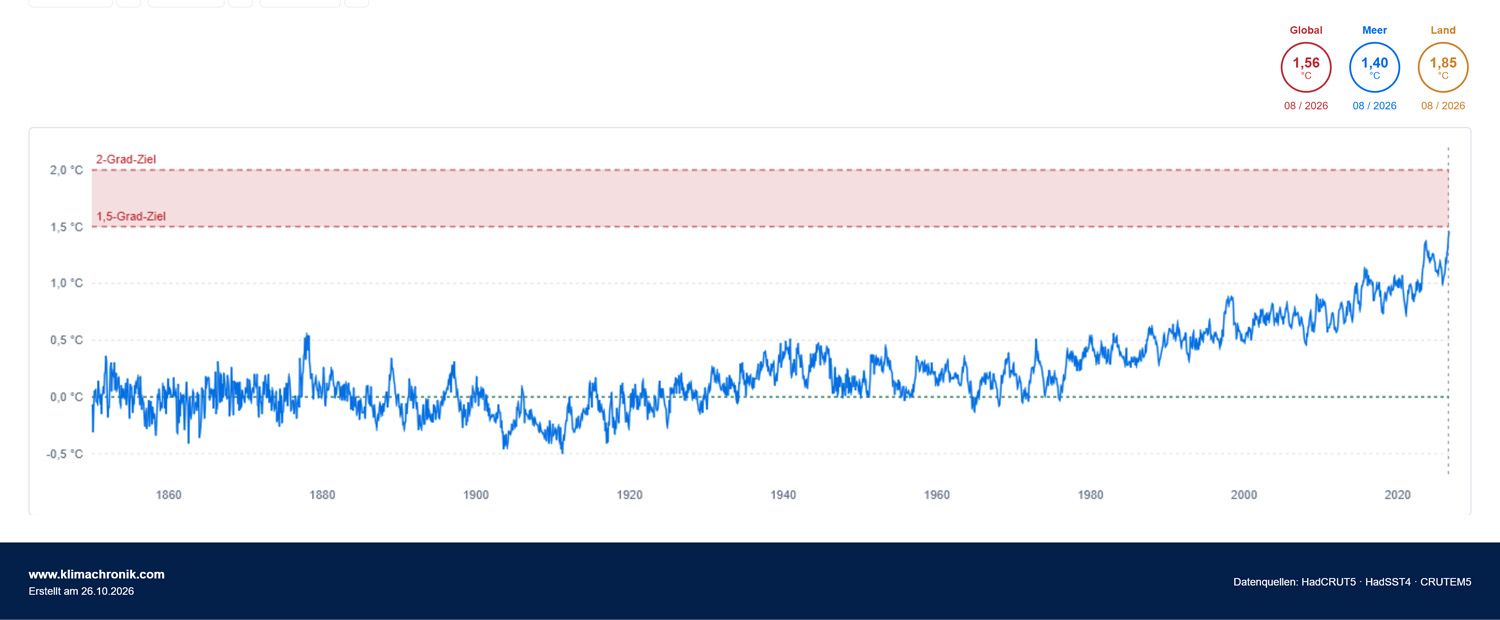
Important: The 1.5°C and 2°C markers in the two individual charts are for orientation only. The combined global land-ocean curve from HadCRUT5 is what matters when assessing the Paris target.
Four Augusts on the world map
I created world maps from the monthly HadCRUT5 grid data to complement the time series. For comparison, I selected four Augusts: 1900, 1950, 2000 and 2026, all shown on the same colour scale. This makes the spatial differences visible.
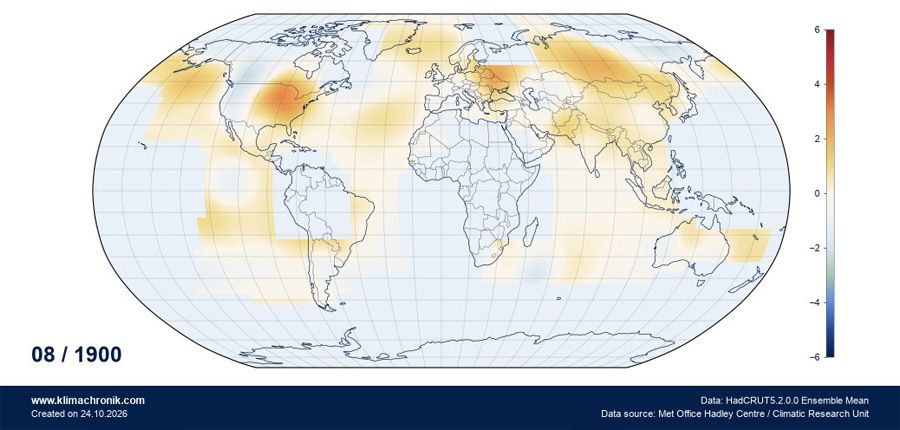
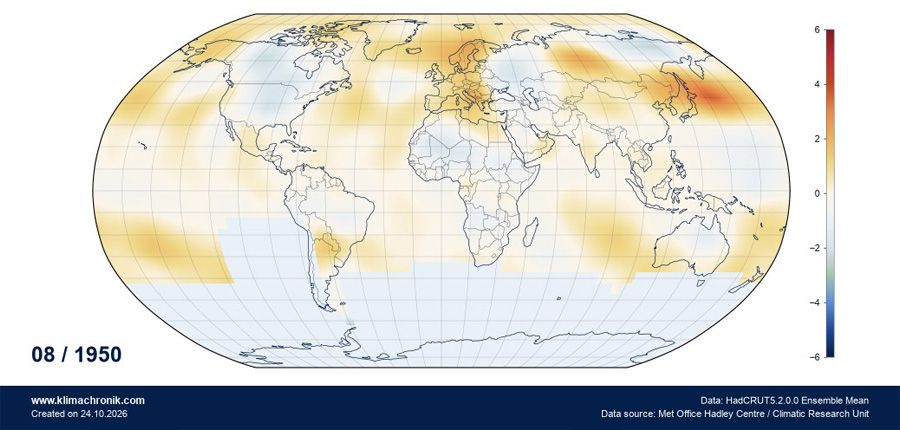
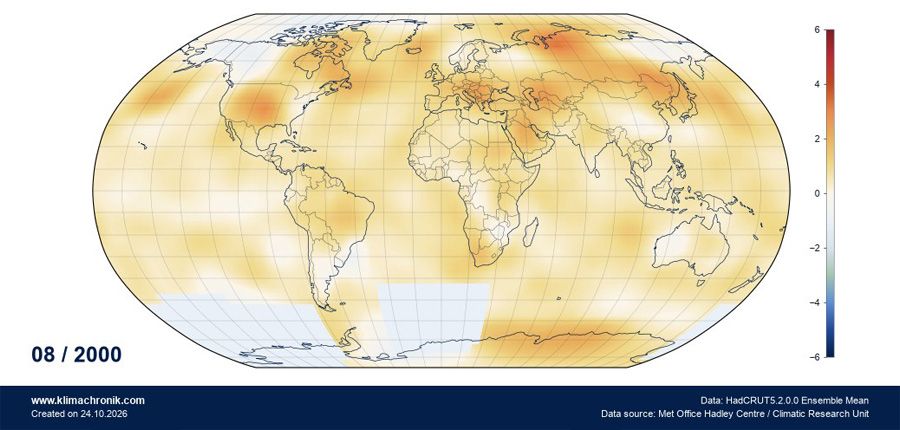
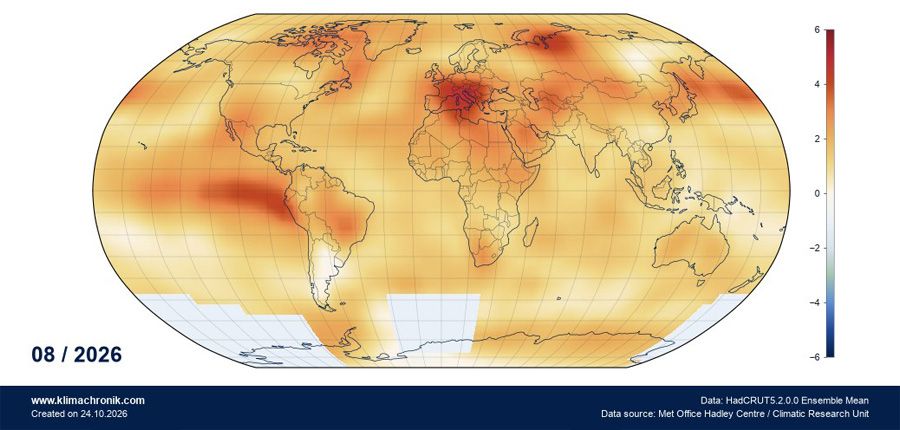
How to read the maps: These are individual Augusts, not long-term averages. All maps use the same global monthly reference for 1850-1900.
For me, the maps primarily complement the long temperature curve. They show the spatial differences, while the time series is better at revealing whether a development persists over decades. The climate analysis explains in more detail how the Climate Chronicle calculates these views.
Half a degree of difference
What changes as the planet warms?
It sounds small: 1.5°C rather than 2°C. But this is not about a single day; it is about additional heat throughout the climate system, with effects that vary greatly from one region to another.
Some changes are already measurable, while others concern possible developments under further warming. The table summarises the most important relationships without suggesting that they occur everywhere to the same extent.
| Change | Status | Potential impacts | Everyday example | Source |
|---|---|---|---|---|
| Heatwaves become more frequent and intense. | Already observed | More heat-related illness and deaths, greater demand for cooling and additional strain on healthcare systems. | An older person may struggle to keep their home cool enough in summer, increasing the risk to their health. | IPCC AR6, WG II |
| Hot nights become more common in many regions. | Already observed | Less cooling at night, poorer sleep and additional strain on health. | A home remains above 25°C at night. Restful sleep becomes more difficult, especially in cities. | IPCC AR6, WG I |
| Heavy rainfall becomes more intense in many regions. | Already observed | More local flooding, overwhelmed drainage systems and damage to buildings and infrastructure. | During a short, severe thunderstorm, water can enter basements and garages, even away from large rivers. | IPCC AR6, WG I |
| Drought and soil dryness increase in some regions. | Already observed regionally | Water shortages, crop failures, forest damage and increasing irrigation needs. | Municipalities may restrict water use, and farmers may need to irrigate more often. If drought reduces harvests, food can become scarcer and more expensive. | IPCC AR6, WG I |
| Glaciers are losing mass worldwide. | Already observed | Changes in river flow and, in the long term, less meltwater in some catchments. | Rivers that depend heavily on glaciers may carry less water in summer over the long term, affecting agriculture and hydropower as well. | IPCC AR6, mountainous regions |
| Snow cover becomes thinner and lasts for less time in many mountain regions. | Already observed | Changes in water storage, earlier snowmelt and effects on the water balance of rivers and soils. | Less snow also means less stored water. More may run off in spring, while less may be available for agriculture and hydropower in summer. | IPCC AR6, mountainous regions |
| Permafrost, meaning permanently frozen ground, is thawing increasingly. | Already observed | Less stable slopes, possible rockfalls and damage to high-altitude infrastructure. | Roads, railway lines and entire settlements are at risk. Buildings must be secured and traffic routes closed. | IPCC AR6, mountainous regions |
| Sea level is rising worldwide. | Already observed; further increase expected | More frequent coastal flooding, erosion and salinization of soils and groundwater. | People lose their homes and their livelihoods; in particularly vulnerable areas, relocation may even become necessary in the long term. | IPCC AR6, synthesis |
| Marine heatwaves become more frequent. | Already observed | Stress on marine life, coral bleaching and changes in fish stocks. | Rising sea temperatures can reduce fish stocks, making fish and seafood scarcer and more expensive and threatening food supplies over the long term. | IPCC AR6, WG I |
| The oceans are becoming more acidic as they absorb CO₂. | Already observed | More difficult formation of shells and coral skeletons; stress on marine ecosystems. | Ocean acidification damages coral reefs and other marine life. This can cause entire ecosystems to become unbalanced, with long-term consequences for fish stocks, tourism and coastal regions. | IPCC, 1.5° report |
| Ice masses at the North and South Poles are changing and, in some places, shrinking. | Already observed; further decline expected | Less ice exposes more dark ocean surface, which absorbs the sun's heat instead of reflecting it. This amplifies warming. | Melting ice reinforces warming: the more ice disappears, the more heat is absorbed, causing temperatures to rise further and still more ice to melt. | IPCC, 1.5° report |
| Wildfire risk is increasing in some regions. | Already observed regionally; further increase expected | Greater fire risk, damage to forests and buildings, and exposure to smoke. | Wildfires can threaten entire communities, destroy homes and force people to evacuate. Smoke can also affect health far from the fire itself. | IPCC AR6, WG I |
| Forests face increasing stress from heat and drought. | Already observed regionally | More tree deaths, greater vulnerability to pests and the loss of important carbon stores. Wildfires also release some of the CO₂ stored in forests. | Firewood may become scarcer in the long term, increasing heating costs. Important recreational areas and protective forests may also be lost. | IPCC AR6, WG II |
| Agricultural yields change because of heat, drought and extreme weather. | Already observed; further changes expected | Crop losses in vulnerable regions, changed growing conditions and possible price increases. Other regions may benefit temporarily. | Poor harvests of grain, fruit or vegetables can reduce supply and make food more expensive. | IPCC AR6, WG II |
| Pollen seasons shift and lengthen for some plants. | Already observed; further changes expected | Longer exposure to allergy-triggering pollen and, in some cases, more severe symptoms. | People with hay fever may experience symptoms earlier in the year or suffer from pollen for longer. | EEA, pollen and climate |
| Ticks and certain mosquitoes change their ranges and periods of activity. | Already observed regionally; further spread possible | Changing risks for tick- or mosquito-borne diseases depending on region. | In some parts of Europe, mosquitoes that were previously rare, and the diseases they transmit, may become more common. | EEA, infectious diseases |
| River flows change, especially in mountain regions. | Already observed regionally; further changes expected | Shifts in seasonal water availability and potential effects on hydropower, irrigation and water supplies. | A hydroelectric power plant may produce less electricity during dry months, while more water is available at other times of the year. | IPCC AR6, mountainous regions |
Context: Not all changes occur equally everywhere. The specific examples show possible consequences for people, not predictions for a particular place. The scale of an impact also depends on regional conditions and the protective measures already in place.
What difference does limiting warming to 1.5°C rather than 2°C make?
The IPCC has published several tangible examples. Tropical warm-water corals could decline by 70 to 90 percent at 1.5°C and by more than 99 percent at 2°C. A practically ice-free Arctic summer would be expected about once per century at 1.5°C, but at least once per decade at 2°C.
The additional half degree also affects sea level. According to the IPCC's 2018 special report, the rise by 2100 would be about ten centimetres lower at 1.5°C than at 2°C. This would not prevent all damage, but it could make a substantial difference to low-lying coasts.
And in the Alps?
Warming here is greater than the global average. Glaciers make this especially visible: they are losing mass, changing the way water is stored in the mountains. I explore what this means for individual glaciers in the article about glacier integration in the Climate Chronicle.
Even so, there is no magic threshold at which everything suddenly tips at exactly 2.0°C. Many risks increase gradually. Some developments can, however, become permanent under certain conditions. The technical term is tipping point; the exact temperature threshold is not known for every system.
Where are we?
Has 1.5°C already been exceeded?
According to the World Meteorological Organization (WMO), the global average temperature in 2024 was about 1.55°C above 1850-1900. In 2025 it was about 1.43°C. How does that fit with the 1.5°C target?
A single year is not a long-term climate average. Natural variations such as El Niño and La Niña can push temperatures up or down in the short term. The Paris target is therefore generally assessed using longer-term warming, not the value of a single year.
Scientific analyses may use periods of 20 years for this purpose. The agreement itself, however, does not prescribe a single binding calculation method. One year above 1.5°C does not automatically mean that the long-term threshold has been permanently crossed, but it shows how close we now are.
What does current research say about the future?
The UNEP Emissions Gap Report 2026 concludes that the long-term 1.5°C threshold is likely to be exceeded temporarily. Under current policies, global warming could reach around 2.8°C during this century and continue to rise thereafter. If announced national climate pledges are fully implemented and comparable efforts continue, the projection is around 2.6°C.
These are not fixed temperatures for the year 2100. They are projections: scientific calculations based on assumptions about future emissions and action.
Researchers are also studying whether temperatures could later return below 1.5°C. That would require greenhouse-gas emissions to fall sharply and additional CO₂ to be removed from the atmosphere over the long term. Even if temperatures fall again, however, not all effects of warming will automatically disappear. A glacier that has already been lost will not simply grow back within the next decade.
Finally
A personal perspective
The 1.5°C figure is neither a temperature forecast nor a magic boundary between safe and dangerous. It is a target agreed by the international community. The data show why it matters whether warming reaches 1.5°C, 2°C or more - and why every additional tenth of a degree counts.
I find it fascinating how much we now know about the development of our climate, even though some of the evidence comes from old weather ledgers and ships' logs. At the same time, it is sobering that we have had this knowledge for decades and the political response has often remained hesitant.
I am, of course, aware of how complex the subject is. Everyone has their own everyday concerns and challenges; I am no different. Who has the time or inclination to work through extensive scientific reports?
That is precisely why I want the Climate Chronicle to make these developments easier to understand and more tangible through actual observations. I believe that the better we understand what these changes mean for our own lives, and what they could mean in the future, the more aware we become. Not through fear or dramatisation, but by understanding what is really at stake.
For further reading